Generating 3D roof meshes from aerial LIDAR data
This is my graduation project I did in computer science. The goal was to come up with a method to generate 3D meshes of building roofs from point cloud data. The point cloud data was taken with aerial LIDAR scanners and is available online. In addition, I used building layout polygons, which are also available as open data. I tested several strategies to generate a mesh and I’ll explain the best one in this post.
Separating the point cloud by buildings
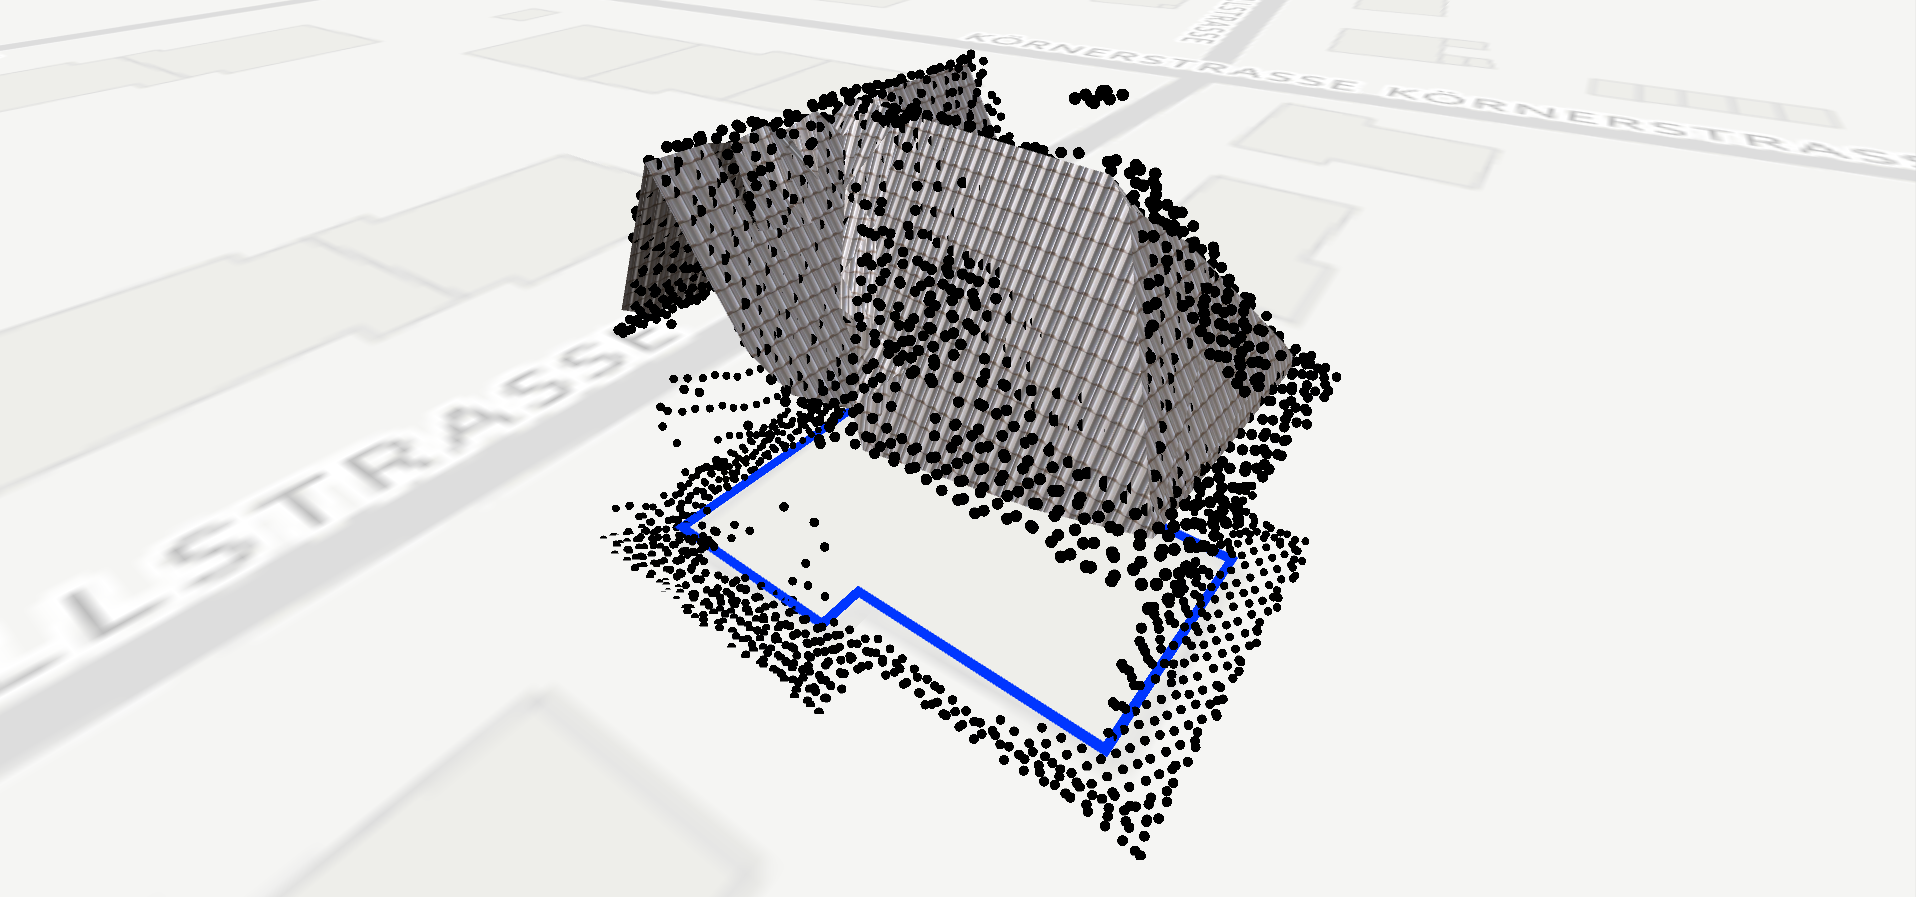
The dataset for the city of Dortmund contains about 4×10^9 points. For this city, the building layout dataset has about 200,000 entries. My first step was to write a program that finds the subset of points that belong to each building.
As the building layouts are polygons, the core of this operation is the point in polygon test. The important takeaway for this part is to use spatial hashing. The polygons are stored in a hash set so that for each point, only a few polygons need to be considered. It took four hours to process 100 GB of data on my laptop.
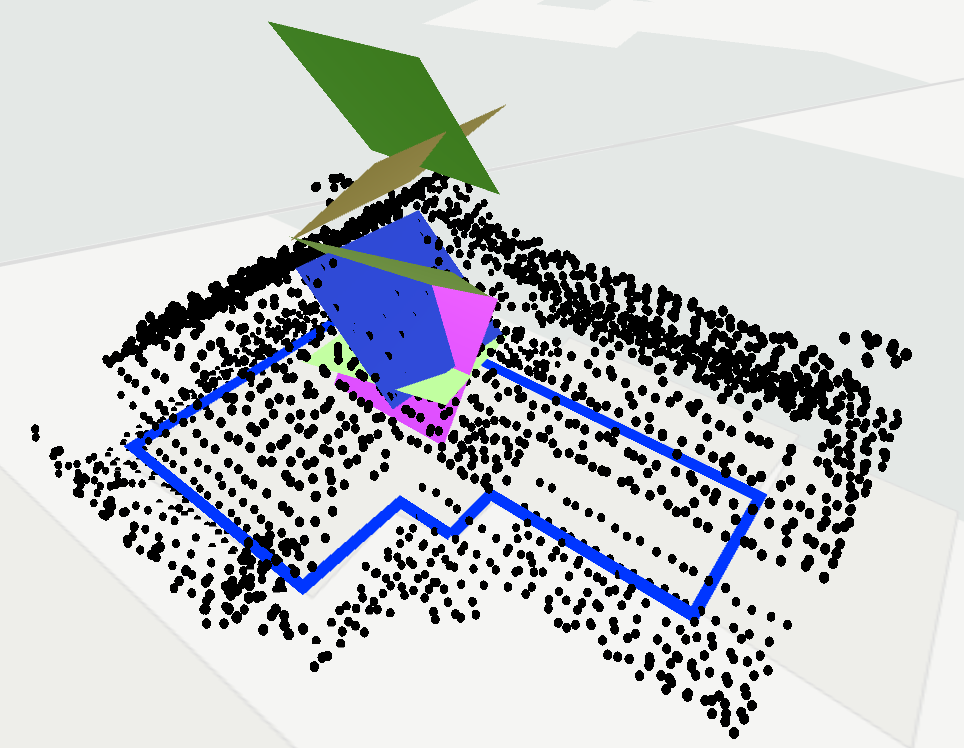
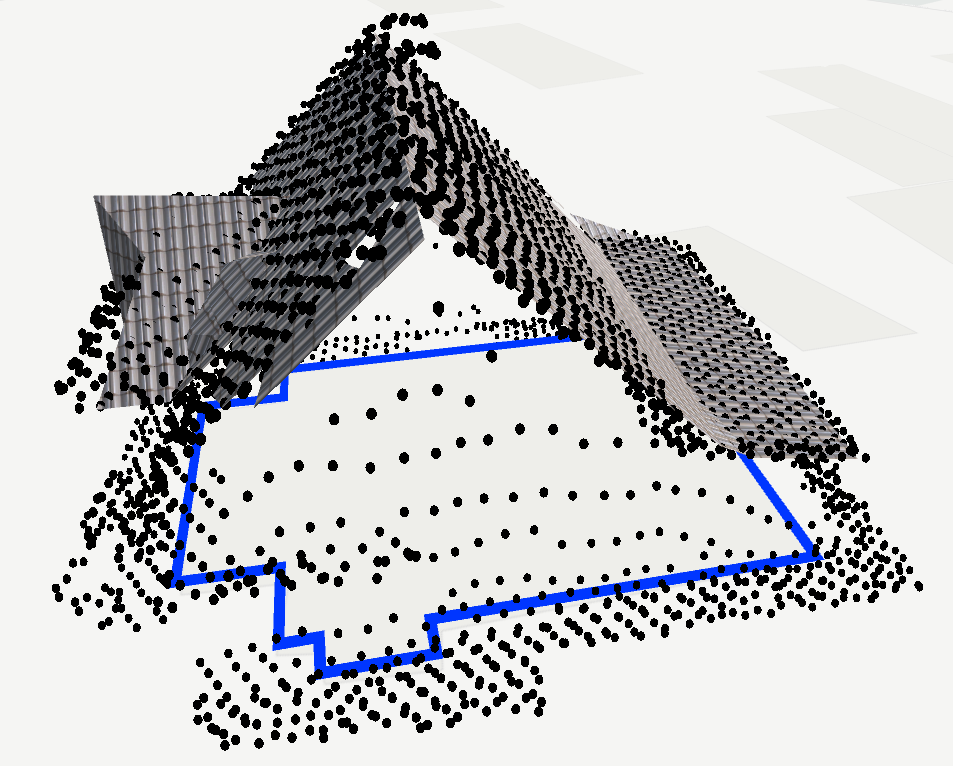
Finding planes
The next step is to look for planes that describe many of the points in a point cloud. These planes are likely to portray roof faces, which makes them a good foundation for generating a roof mesh.
It turned out that a RANSAC approach works well for this problem. The idea of RANSAC is to select a subset of points at random and generate planes from these sample points. To get a sample plane from a sample point, a fit plane for nearby points is calculated. For each sample plane, a score is calculated that tells how well the plane fits the entire point cloud. The best scoring planes are returned.
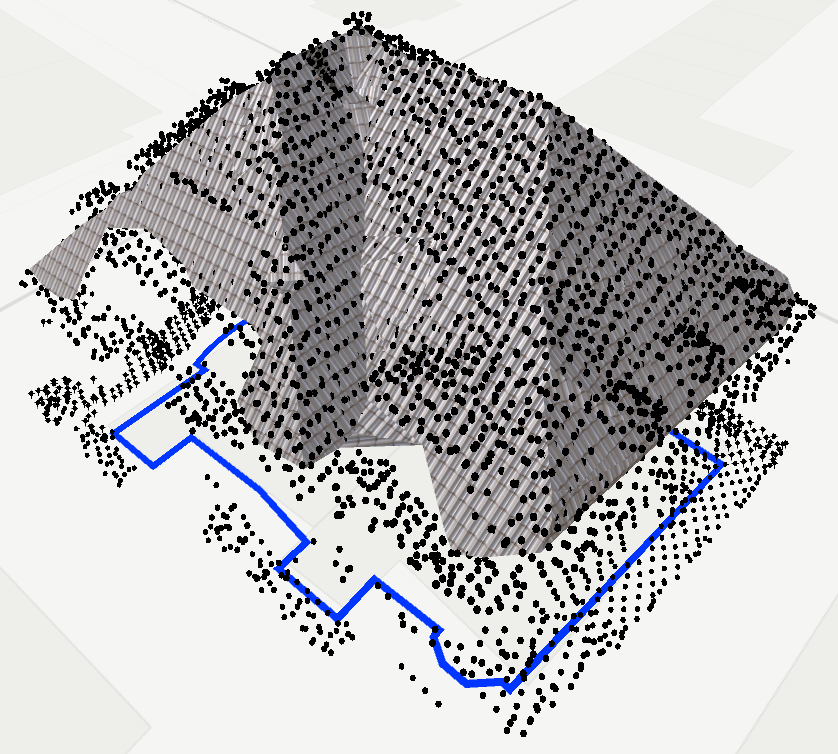
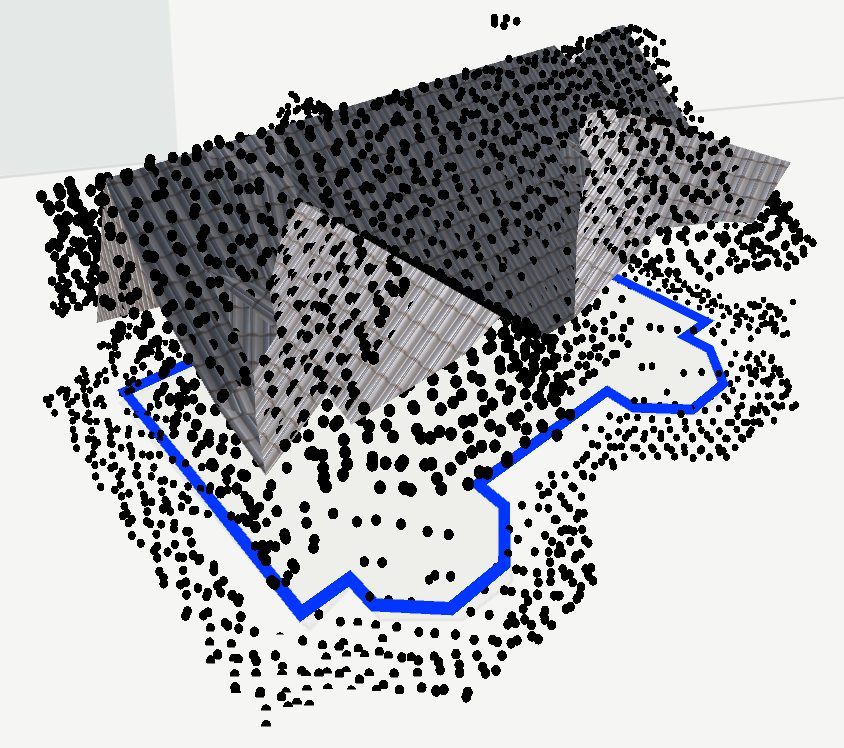
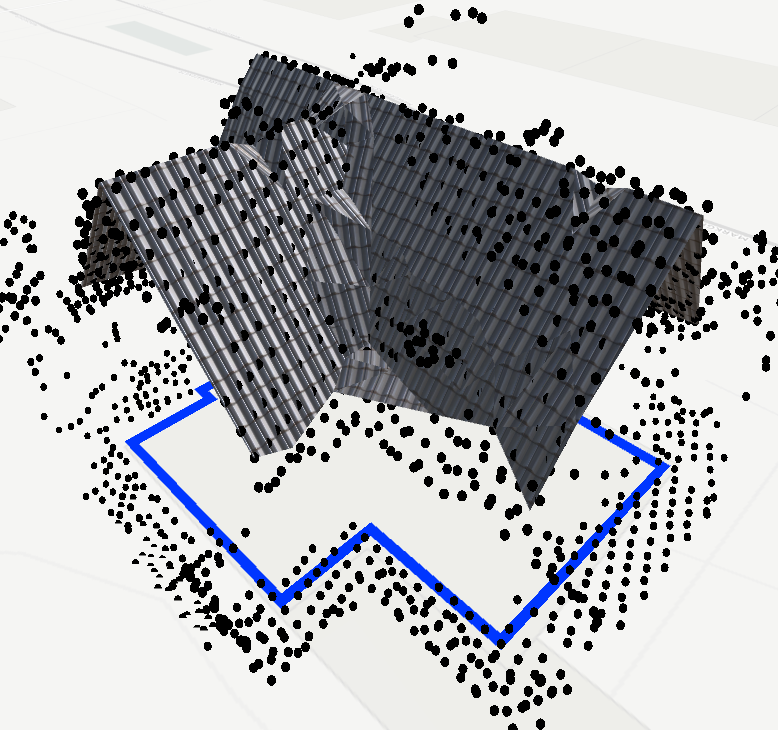
The picture below shows an example point cloud with planes found by the RANSAC algorithm.
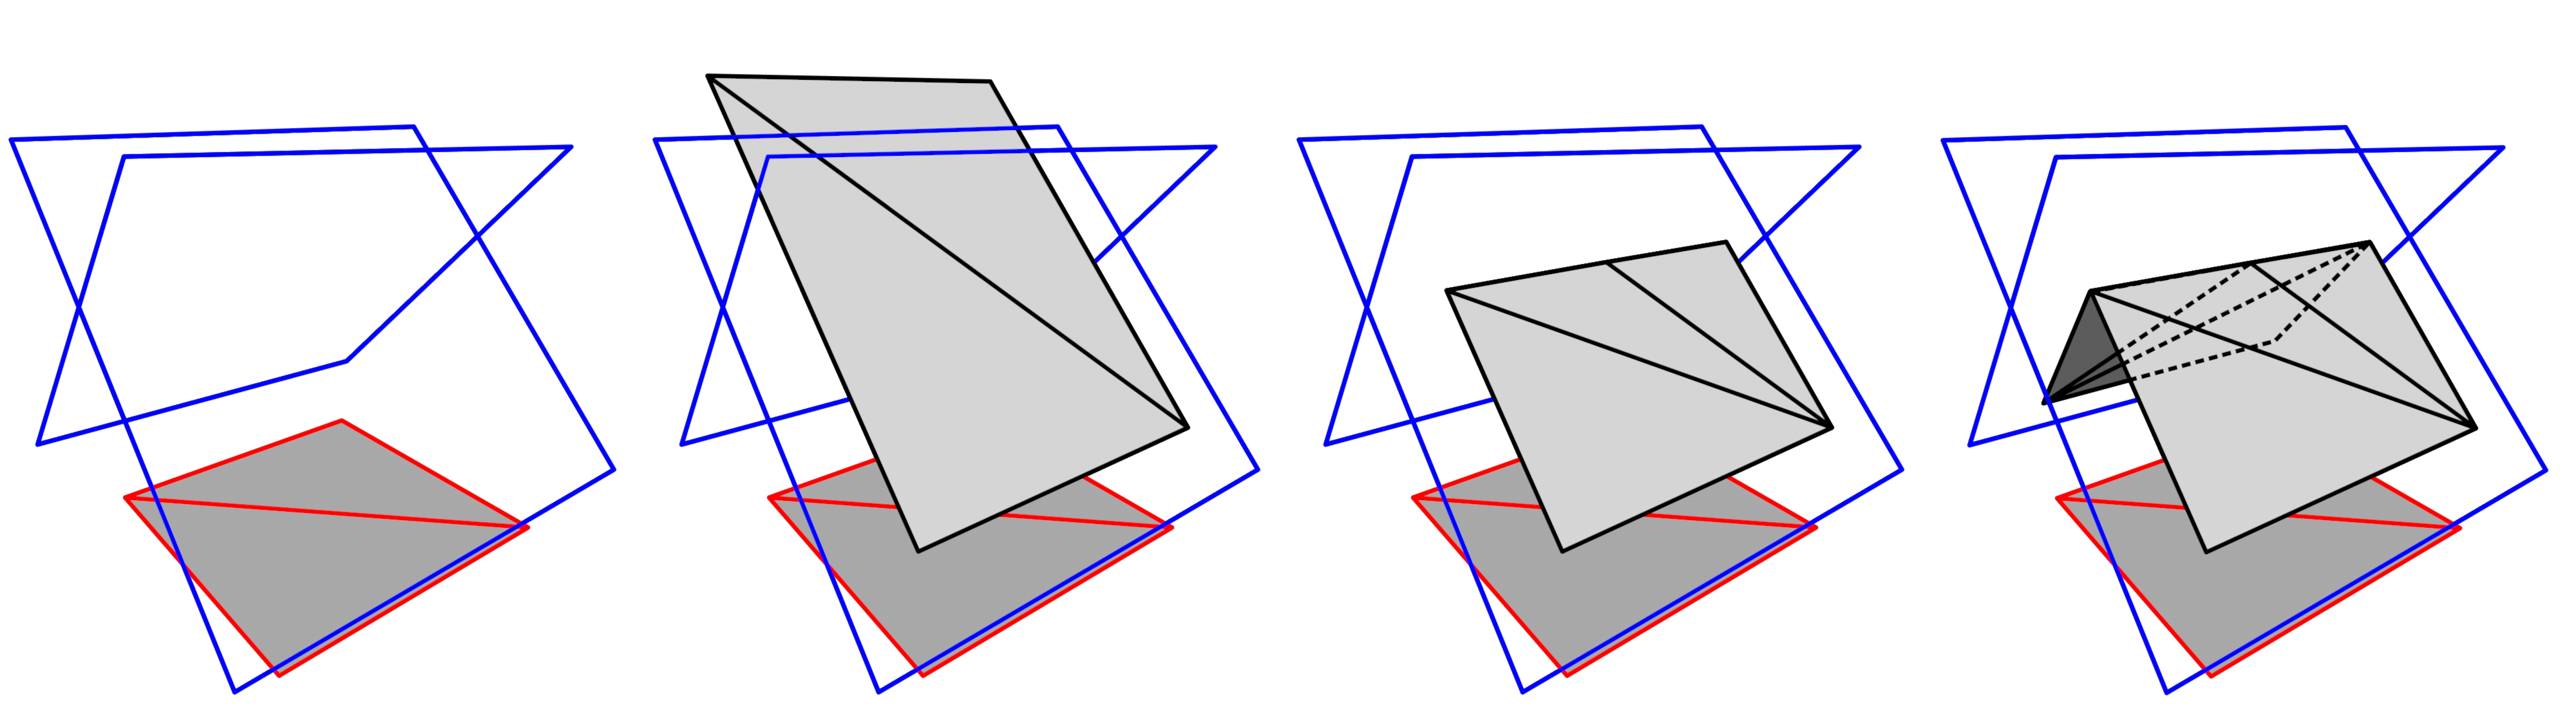
Algorithm to generate convex roof meshes
Now that we have a set of points that belong to a single building, the building’s layout polygon and a set of planes, it’s time for a mesh generation algorithm. The idea of this algorithm is to start with an infinetly extruded layout polygon and cut away each of the roof plane. Each cut creates a roof face.
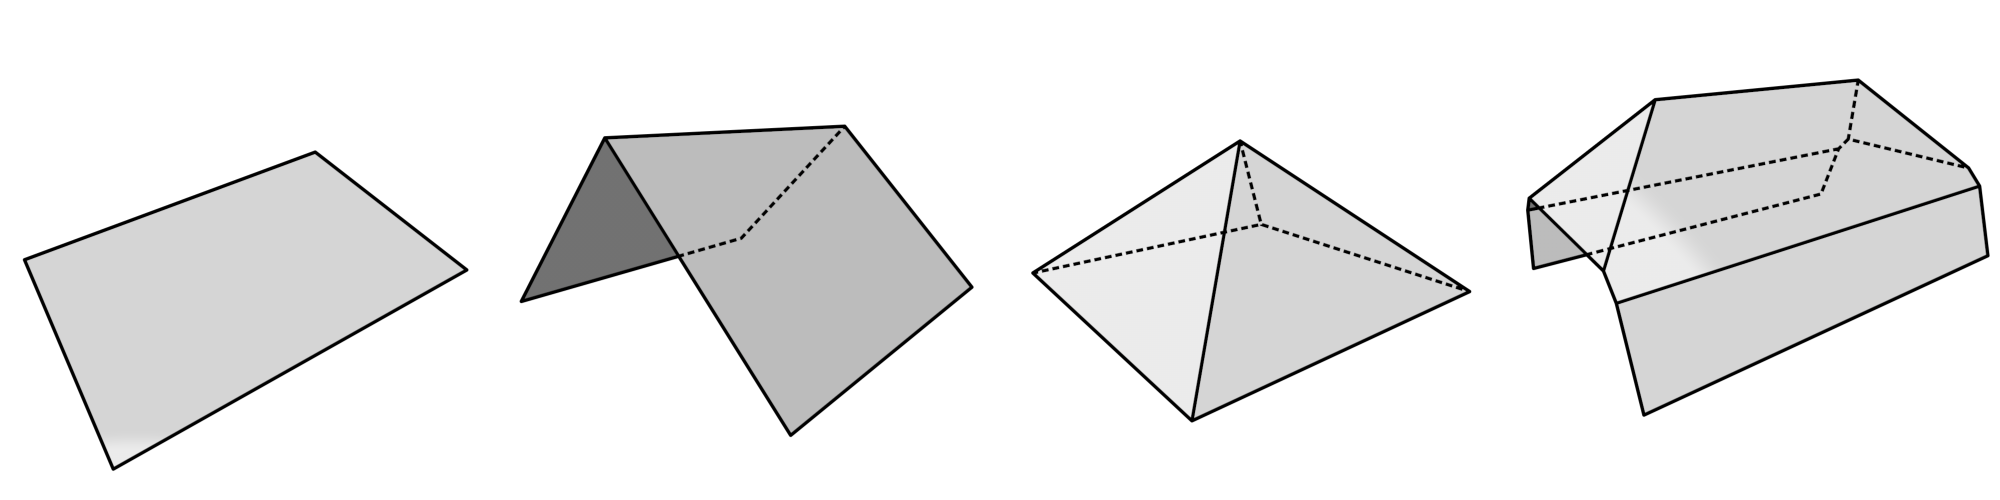
Here are some examples of roof types that can be modeled this way:
The algorithm to generate these meshes works a bit different from the explanation above. For each roof face, the layout polygon is triangulated and projected onto the plane. In a second step, this mesh is cut along all roof planes, leaving only the geometry that lies below all other planes. All roof faces are generated like this and are then combined.
This graphic shows a run of this algorithm with a simple gabled roof. Two roof planes result in two roof faces. For each plane, there is only one other plane that is cut away from the mesh.
The choice of roof planes is quite important, as the RANSAC algorithm usually returns more than the desired set of planes. To find the best ones, each possible subset of planes is tested. Each time, a roof mesh is generated and scored. The best one is returned.
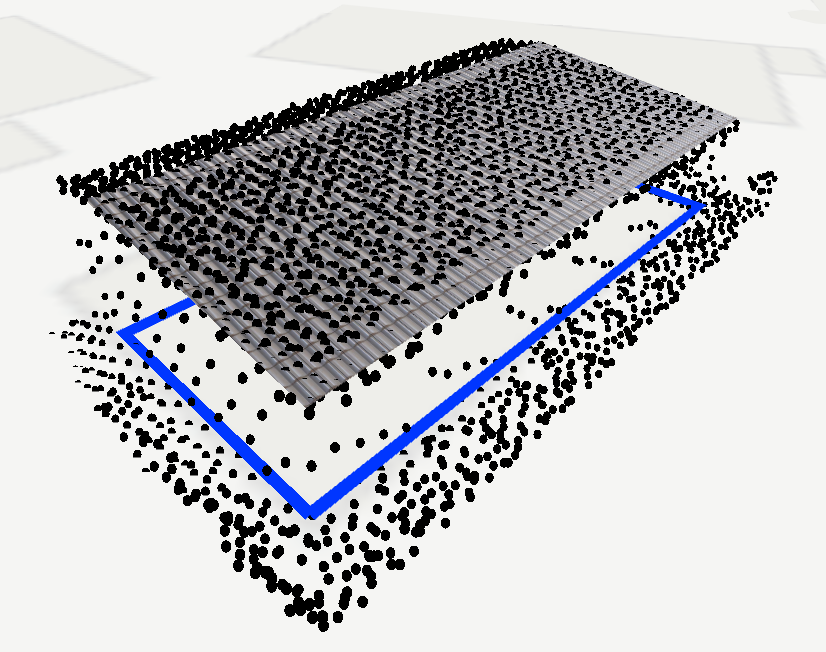
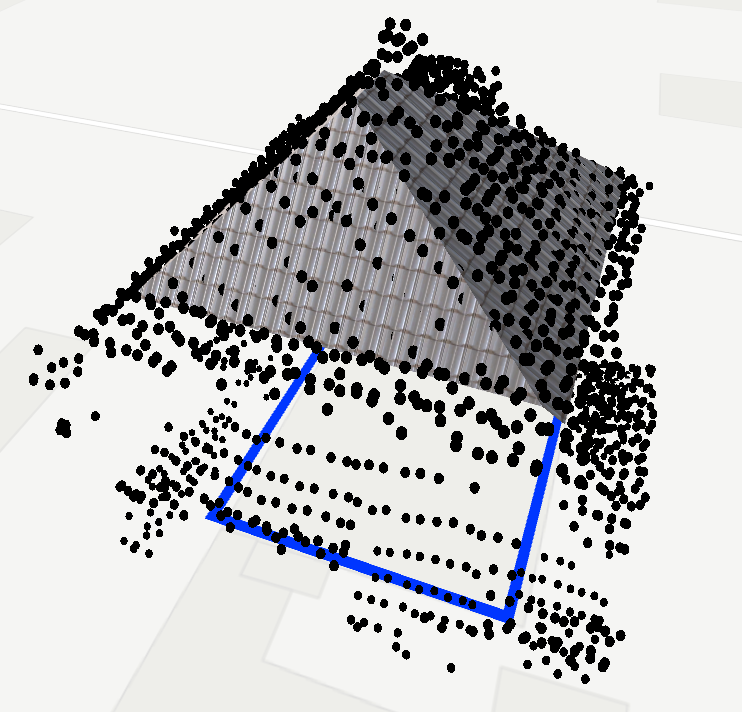
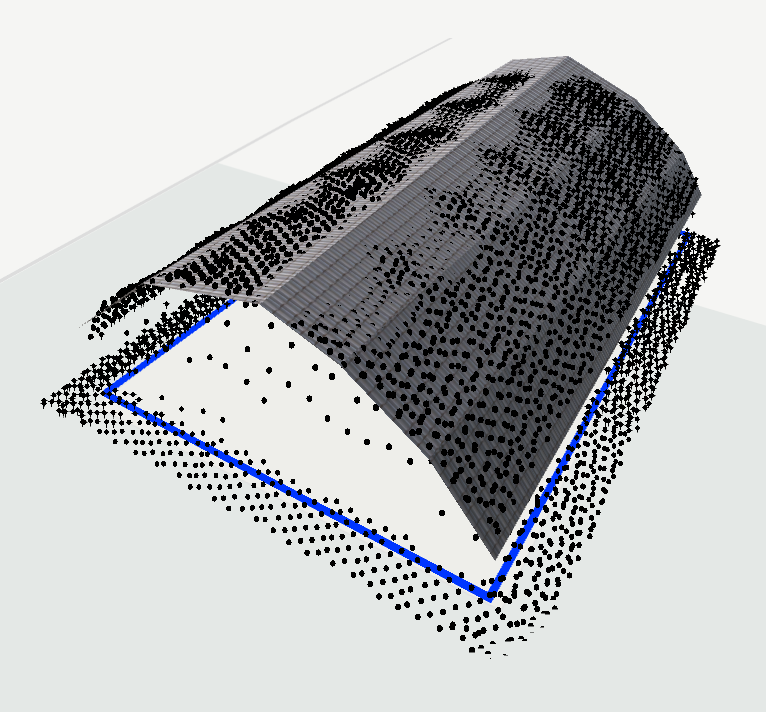
Here are some examples of meshes generated with the above algorithm:
|

|
|
|
Attachments
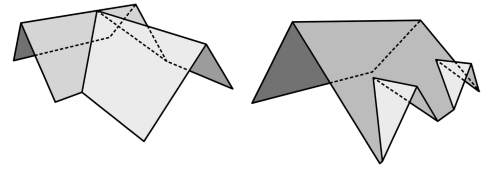
As the name suggests, the algorithm to generate convex roofs is limited to convex roofs. In the real world, many roofs aren’t convex, like these ones:
To generete roof meshes for these roofs, I extended the algorithm to look for attachments. It starts with a convex roof. For each face, the subset of points above the roof plane is considered. The same algorithm is used to generate meshes for attachments. These attachments are added to the resulting mesh.
A postprocessing step is needed to avoid some unwanted geometry that arises from combining the base mesh with the attachment meshes. Sometimes, this step introduces unwanted artifacts in the result.
Here are some exmaples of convex roofs with attachments:
|
|
|
|
Implementation
I used the Unity game engine to test the algorithms. Unity makes it easy to display meshes and point clouds. For common geometry problems like triangulating polygons, there is code available online.

You can find the source code for the Unity implementation on github.
Data sources
The point data used in the screenshots in this article was calculated using point data and shape data from https://www.opengeodata.nrw.de/ Source for point data: https://www.opengeodata.nrw.de/produkte/geobasis/dom/dom1l/dom1l_05913000_Dortmund_EPSG25832_XYZ.zip Source for shape data: https://www.opengeodata.nrw.de/produkte/geobasis/lika/alkis_sek/hu_nw/hu_nw_EPSG4647_Shape.zip The data was provided by the "Land NRW" under the Data licence Germany – attribution – Version 2.0 (dl-de/by-2-0) Full license text is available at http://www.govdata.de/dl-de/by-2-0 The screenshots in this article contain map data by OpenStreetMap (ODbL) and Positron tiles by CartoDB (CC BY 3.0).